Guide to graphreader.com
Here is a quick guide for the elementary operations of the graphreader tool. In all, only a few steps are needed to extract data from graph image and save it as CSV data.
Upload image
Select an image, not too large and not too many MB and press 'Go'
If valid, the image should now display below.
Define axis scaling
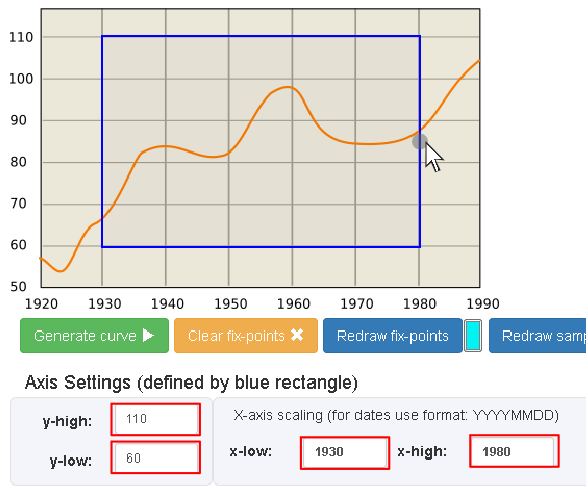
Grab the corners and sides on the blue reactangle and enter the corresponding values for y-high, y-low
and x-low and x-high, to set a ruler for the x and y scaling of graph area. Note, the curve area
is not restricted to be inside the blue rectangle.
Furthermore, enter the x-axis step size / intervals to define the curve sampling x-values.
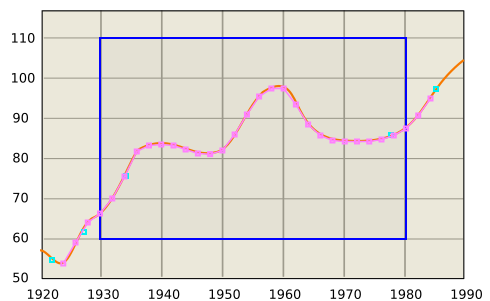
Add fix-points

Simply double click to add a new point (on tablet double tap). Right click will delete a point (on table long touch).
Start and end fix-points will determine the x-range for the sampled curve segment.
Fix-points are used for the manual and automatic interpolation of the curve segments.
Simple interpolation
Having defined the fix-points, choose 'Interpolation', and select either linear or spline type interpolation, and hit 'Generate curve'. The curve will now be sampled based on fix-points and the given x-axis intervals. See the result on the graph (you may need to click Redraw sampled curve). The resulting CSV data can also be found in the field below.
Machine estimation (beta)
Machine estimation will try to automatically track the curve segment, learned from the fix-points on the desired curve you have entered. Try placing a few curve fix-points on desired curve. Start and end fix-points will determine the x-range. Being still under developemnt, this feature works best with rather distinct curves. It may run into problems when different curves are crossing each other, or when the curve is has low contrast to the bacgkground color.
Post processing
Optionally, it is possible to generate an additional data set, where a simple filter is applied post process to the sampled curve. You can choose: 'Simple average', 'Running average', 'Moving Average', 'Linera Regression' and 'Spline approximation'. The resulting dataset will be show in the respective CSV data-field at the bottom of the page.
Export CSV output

Every time the 'Generate Curve' button is pressed, the generated data output will be updated in the CSV output boxes at the bottom of the page.
You may copy this CSV data into yor text editor or application. Press 'Export data' to open the raw data in a blob in
a new window. Use this to save or link the data with online graphing tools or applications such as:
plotly - https://plot.ly/
Demos - https://www.desmos.com/
Onlinecharttools - https://www.onlinecharttool.com/graph
Google Spreadcheets - https://docs.google.com/spreadsheets/
Microsoft Excel